ECS200 - Research Methods in Ecology
School of Environmental and Conservation Sciences, Murdoch University
All workshop materials are provided in the github repository ECS200, and the contents were developed by Nicholas Wu and Alethea Rea.
Welcome
The ECS200 - Research Methods in Ecology workshops will go through the steps of a typical data science project that looks something like Figure 1.
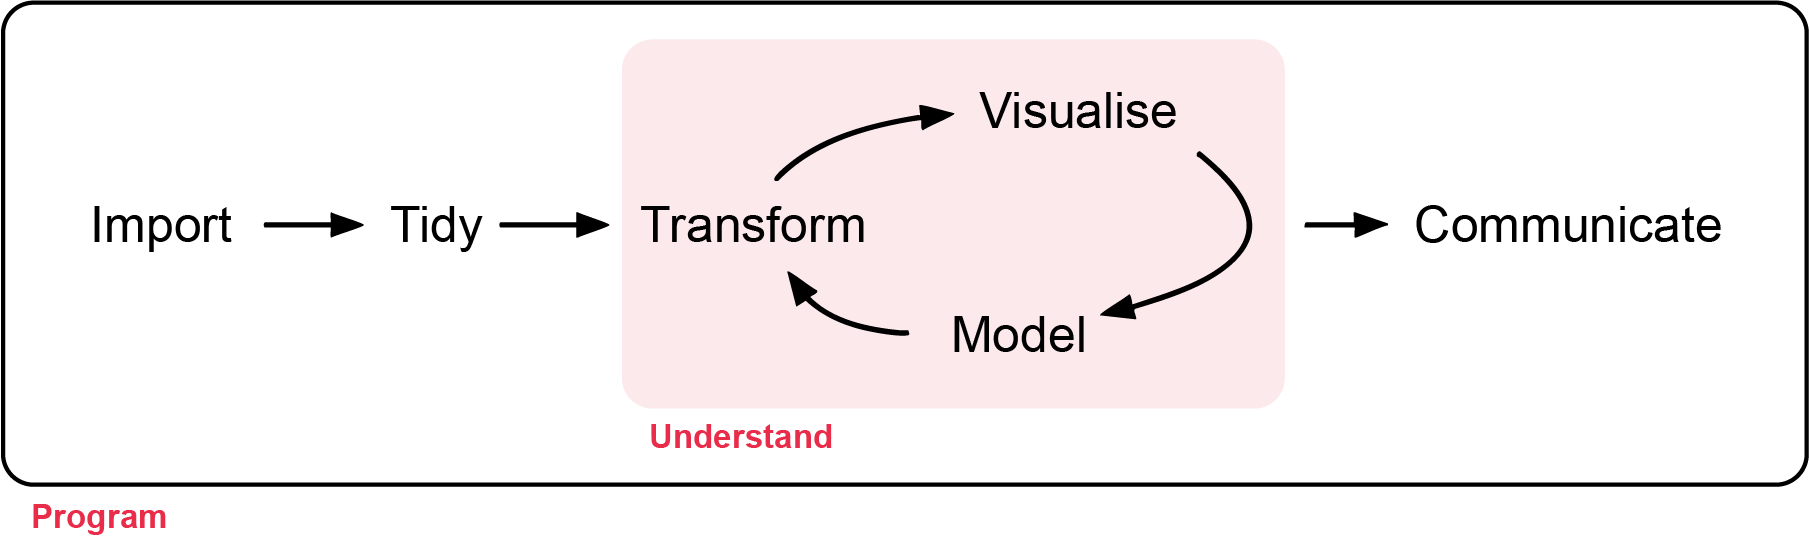
First, you must import (week 1) your data into R. This usually means loading data stored in a file, database, or web application programming interface (API) into a data frame in R. If you can’t get your data into R, you can’t do any data science with it!
Once your data is imported, it’s a good idea to tidy (week 2) it. Tidying means putting it into a consistent format where each column is a variable and each row is an observation. This alignment between the structure and meaning of the data makes analysis far easier. Tidy data lets you focus on answering questions rather than reformatting for each new task.
Next, you’ll often transform (week 2) your data. This might include filtering for specific observations (e.g. animals from one site or data from the past year), creating new variables (e.g. calculating speed from distance and time), or summarising patterns (e.g. counts or averages). Tidying and transforming are often called wrangling, because getting data into a usable form can feel like a struggle!
Once you have tidy, relevant data, you’ll typically turn to two main tools: visualisation and modelling. These are complementary, and most analyses move back and forth between them.
Visualisation (week 4) is fundamental. A good plot can reveal unexpected patterns or raise new questions. It might even suggest you’re asking the wrong question or need better data. Visualisations can be powerful—but they don’t scale well, since they rely on human interpretation.
Models (week 5 to week 12) complement visualisation. Once you’ve clearly defined your questions, a model can help answer them. Models are mathematical or computational, so they scale well—and if needed, more computers are easier to get than more people! However, models come with assumptions and can’t question those assumptions or truly surprise you.
The final step in data science is communication (visualisation and model weeks). Even the best models or visuals are useless unless you can clearly explain your findings to others. Effective communication is critical.
Surrounding all these activities is programming. You’ll use code throughout every step of a data science project. You don’t need to be a programming expert, but improving your coding skills pays off—it helps you automate tasks and solve problems more efficiently.
Learning Objectives of the Unit
At the end of the unit, students should be able to:
- Design ecological research using appropriate sampling strategies and analytical methods.
- Apply appropriate statistical methods to test ecological hypotheses.
- Apply R programming to process, analyse, and visualise ecological datasets to professional standards.
- Critically evaluate the strengths and limitations of research designs under different ecological conditions.
- Communicate the findings of ecological research to professional standards.
Schedule
| Week | Topic | Date | Time | Room |
|---|---|---|---|---|
| 1 | Data quality checks | 25-Feb | 8:30 - 10:30 | 450.2.001 |
| 2 | Tidy data and clean code | 04-Mar | 8:30 - 10:30 | 450.2.001 |
| 3 | Diversity indices | 11-Mar | 8:30 - 10:30 | 450.2.001 |
| 4 | Descriptive statistics | 18-Mar | 8:30 - 10:30 | 450.2.001 |
| 5 | t-test, ANOVA, simple regression | 25-Mar | 8:30 - 10:30 | 450.2.001 |
| 6 | Chi-square and non-parametric tests | 01-Apr | 8:30 - 10:30 | 450.2.001 |
| 7 | Study Week Optional tutorial - Time series | |||
| 8 | Multiple regression | 15-Apr | 8:30 - 10:30 | 450.2.001 |
| 9 | Mid-semester test Optional tutorial - Spatial data | 22-Apr | 8:30 - 10:30 | 450.2.001 |
| 10 | Study Week Optional tutorial - Movement data | |||
| 11 | Generalised linear model | 06-May | 8:30 - 10:30 | 450.2.001 |
| 12 | Extensions to GLMs | 13-May | 8:30 - 10:30 | 450.2.001 |
Contact
If you spot any error with the workshop material please let the unit coordinator know at nicholas.wu@murdoch.edu.au